


THREE Great Features of the Sanipath Tool
The SaniPath team has created an exposure assessment tool for low-resource, urban areas with poor sanitation. Key features of the tool include its accessibility, its easy to understand results, and its potential to influence policy.
1. The SaniPath Tool is easy to use and understand
The SaniPath Tool was designed to be used independently by a variety of organizations interested in improving urban sanitation. A detailed user guide for data collection and laboratory work, automated analyses, and output that can be understood by anyone with a basic scientific background, make the tool easy to use and understand. Minimum requirements for use of the tool include:
- A funding source (ex: local government or international organization)
- A lab with the ability to detect E. coli and technicians to carry out the procedures in a sterile environment
- A team with experience conducting surveys
- A local group to distribute results to government and policy makers
2. The results from the tool’s analysis are straightforward and summarize the sanitation-related health risks in low-resource, urban settings
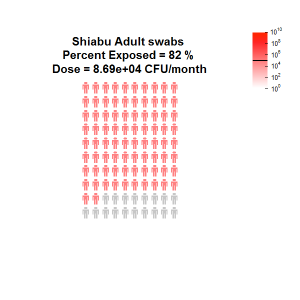
The tool’s software automatically analyzes the collected data and produces graphical representations. The results allow users to compare the exposures from different sanitation pathways. Results also show the relative risk of pathways within neighborhood or across neighborhoods. The figure below is an example of a risk profile showing the monthly exposure in a neighborhood from a particular pathway, in this case, consumption of raw produce. The shade of the red color correlates with the dose (measured by the predicted number of colony forming units (CFU) of E. coli ingested per month). The scale to the right shows the relative magnitude of the dose. The number of red people represents the percentage of people exposed to fecal contamination from a particular pathway in a given month, while the gray people are those that are not exposed. The use of colors and people creates a powerful platform for the results to be used and understood. The results can be understood and interpreted by decision makers to influence policy.
3. The SaniPath Tool can be can be used for advocacy to prioritize sanitation needs
By comparing the risk of exposure, the results illustrate which contaminated pathways pose the greatest potential risk to public health in a given area. This allows policy makers to prioritize which exposures to target and make decisions informed by public health risk to get the greatest return on sanitation investment. The pathways assessed by the tool include those in the public domain as these have potential for action by policy makers. The pathways include:
- Surface water (rivers/lakes/ponds)
- Ocean water
- Open drains
- Flood water
- Municipal drinking water
- Bathing water
- Public latrines
- Produce (fruits/vegetables)
- Soil
In summary the SaniPath Tool improves understanding of risks from fecal contamination in urban settings in low-income countries. Ultimately, the tool can be used to develop effective strategies to reduce these risks.
This blog was written by Jillian Cordes, a graduating MPH student at the Rollins School of Public Health.
Mamadou Lamine DIARRA
April 27, 2016 at 9:48 amVery helpful tool for urban WASH workers. Is it possible to have a French version?
j.michiel@emory.edu
August 19, 2016 at 10:51 amHello, and apologies for not seeing this comment sooner–for information on specific deployments, including possible translations, please contact our project manager using the contact information in the footer of this website. Thank you!